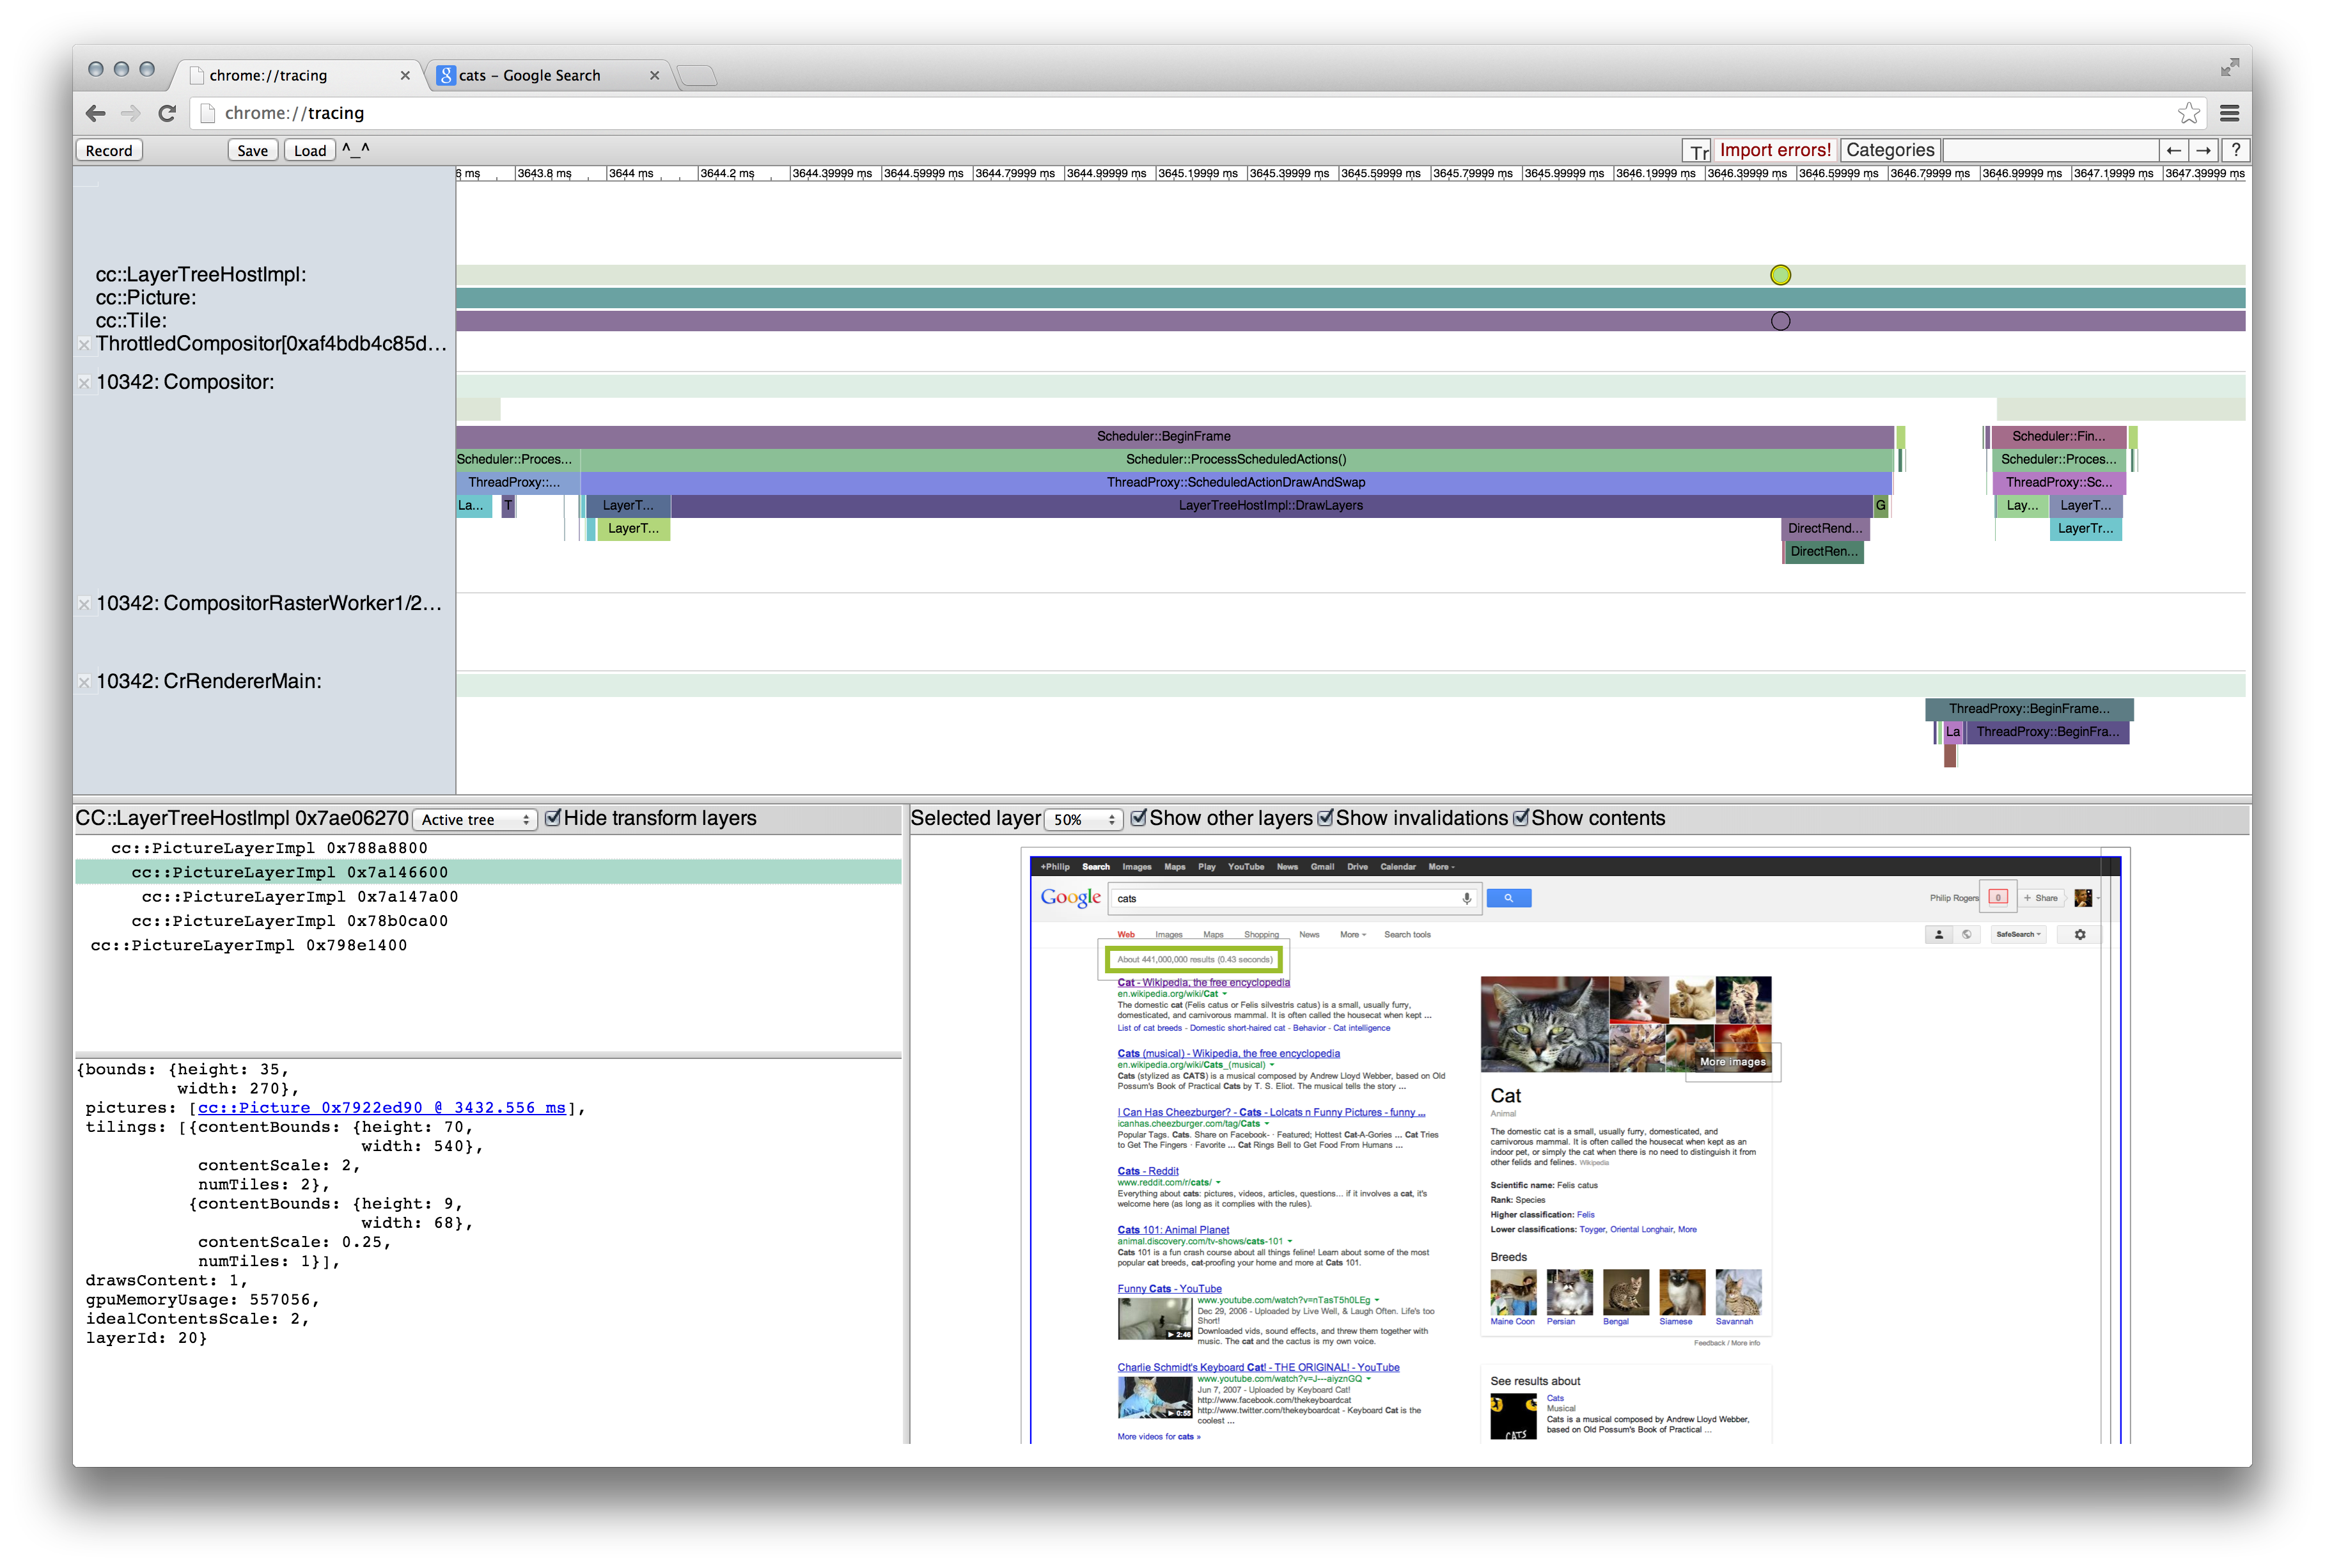
Chrome Frame Viewer Overview and Getting Started
The frame viewer is a feature in Chrome's about:tracing for studying difficult rendering performance problems.
Getting started
Frame viewer is best used in Chrome Canary, but viewing traces requires that you launch with special flags. On OSX, the appropriate incantation is:
/Applications/Google\ Chrome\ Canary.app/Contents/MacOS/Google\ Chrome\ Canary --enable-skia-benchmarking
When you have such a build:
- Go to about:tracing and press record
- Check the Frame Viewer option.
- Press Record
- Go to some other tab, refresh, then do the janky action.
- Go back to tracing and press stop.
- Scroll through the tracks (using W, A, S, and D) looking for the "cc::LayerTreehostImpl" track. Click a dot on that track and you will get a viewer for that frame.
Reporting Rendering Performance Bugs
The best performance bug reports come with two traces: one taken with frame viewer on, and one taken with frame viewer off. We use both because frame viewer, while fast, is still intrusive to total performance. To do this:
- Start up chrome with the frame viewer command line, above.
- Record a trace of your slow action, with cc.debug and cc.debug.display_items ==unchecked==. This is your true performance trace. We will use that to understand whether the performance issue is functional [requiring the frame viewer data] or raw performance related [requiring just the performance data]
- Without rebooting chrome or changing its command line, record a second trace, now with cc.debug and cc.debug.display_items ==checked==. This is the frame viewer trace and lets us understand functional issues in the page that may lead to performance problems.
Frame Viewer on Android
You can trace a USB-connected Android device remotely from the chrome://inspect/?tracing#devices URL. Alternatively, there is a command line script in the Chrome repository that provides the same functionality. For example, this command captures a 5 second trace with frame viewer data from the stable version of Chrome on an Android device:
build/android/adb_profile_chrome --browser=stable --trace-frame-viewer -t 5
The script downloads the resulting trace file to the current directory. You can view it by opening Chrome on your desktop, going to about:tracing and clicking on "Load". The chrome you load it into must be a similar version of chrome (within ~2 major versions) of your Android build for it to load properly. The viewing browser must have the --enable-skia-benchmarking flag set to see the frame images.
Some notes
- Arrow keys move between frames, once you have selected them
